
The S&P 500 Index has gained more than 20% so far this year, making more than 50 record highs along the way. Certainly nobody should be upset with that return if that was all 2021 brought us. However, we see signs that there could be more gains to come in the final two months of the year. Seasonal tailwinds, improving market internals, and clear signs of a peak in the Delta variant all provide potential fuel for equities heading into year-end, and we maintain our overweight equities recommendation as a result.
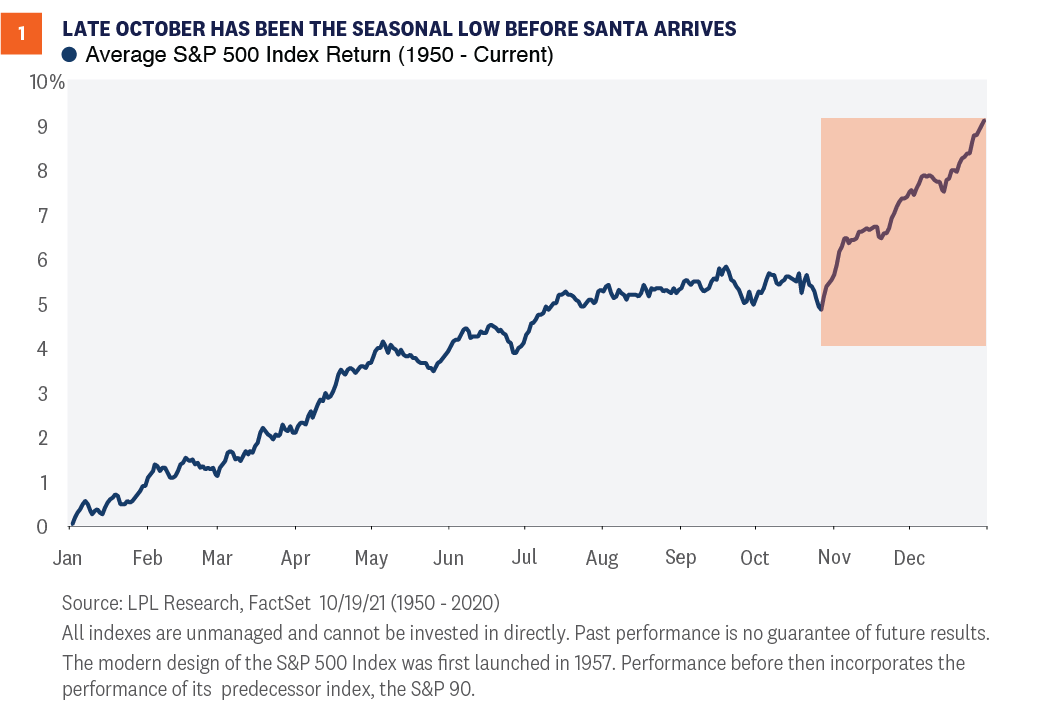
Late October is the Seasonal Low
One of the most important points we believe investors should recognize is that there has been a sort of stealth correction going on throughout most of the summer, consistent with the historically weak period commonly referred to as “Sell in May and Go Away.” While the S&P 500 has returned more than 8% since the end of April, the average individual stock in the index suffered more than a 10% correction. Meanwhile, the average stock in the Russell 2000 Index (covering small cap equities), which is almost unchanged over that period, suffered a more than 25% bear market.
However, as shown in [Figure 1], late October has historically marked the seasonal low before stocks typically rally into year-end. In fact, the fourth quarter as a whole is by far the strongest quarter historically, on average, with the S&P 500 rising 4% and finishing higher nearly 80% of the time. November, meanwhile, is the strongest month of the year—both since 1950 and over the past decade. So, whether you believe that stocks have thus far followed the historical pattern of summer weakness that should be ending, or that the current price trend is so strong that it was able to buck the summer doldrums, we see ample reason to believe that seasonality has now turned from a headwind for equities to a tailwind.
Improving Market Internals
Seasonality is something that we want to be aware of, but perhaps more important to our thesis is what technicals and market internals are showing us right now. As we just discussed, much of the market has corrected over recent months, but are key groups showing signs of improvement? The answer is clearly yes. Economically sensitive groups of stocks, commodities, and even bond yields had largely stagnated since early May—but have recently reaccelerated. For example:
- The S&P 500 Financials Sector just broke out to a new all-time high after being largely unchanged from May 7 through October 13.
- The Dow Jones Transportation Average is up more than 10% in October alone—and at a three-month high after suffering a 13% correction.
- Copper, often referred to as Dr. Copper for its ability to forecast economic conditions, has gained more than 10% since bottoming in August.
- The yield on the 10-year U.S. Treasury is up more than 50 basis points (0.50%) since its low in July.
- Consumer discretionary stocks have outperformed consumer staples stocks by 10 percentage points in the past two months after lagging them for much of the summer.
There are certainly more examples, but let’s not forget perhaps the most important indicator: price. After finally suffering its first 5% pullback of 2021 in early October, the S&P 500 has come roaring back and closed at a record high on October 21. We firmly believe that new highs are something to be embraced, not feared, and history shows that new highs tend to come in bunches—something that has certainly been true so far this year.
Data Strong Amid Clear Signs of a Delta Peak
Though the above points may be construed as a technical argument for strength into year-end, make no mistake: The fundamentals are improving in real time as well. The rolling seven-day rate of new COVID-19 cases has fallen over 60% from its peak in early September. No doubt connected to the decrease in cases, jobless claims have fallen steadily in recent weeks, with continuing claims sliding below 2.5 million for the first time since the pandemic began.
Recent economic data shows that Americans have taken notice of the improved outlook. Economists expected retail sales to fall slightly in September, but the report showed that overall retail sales grew 0.7%. Despite the impact of the COVID-19 Delta variant wave, retail sales have grown three of the past four months, providing further evidence of the strength of the U.S. consumer. Finally, the U.S. Bureau of Labor Statistics (BLS) latest Job Openings and Labor Turnover Survey (JOLTS) report showed that the number of American workers who are voluntarily quitting their jobs is at its highest rate since the BLS started publishing data in 2001. Typically, quits are viewed as a sign of a strong economy and healthy labor market, as the most common reason for people voluntarily leaving their job is to start a new one—something workers are more hesitant to do in times of economic uncertainty.
Conclusion
LPL Research continues to believe that tactical investors should tilt portfolios in favor of stocks over bonds relative to their respective targets. Modestly rising interest rates and tight credit spreads reflect a healthy and improving economy, but should add pressure to fixed income returns in the near-term. Meanwhile, a bullish part of the calendar, improving equity market internals, and falling COVID-19 cases may clear the way for a potentially bullish environment for equities through year-end.
Click here to download a PDF of this report.
IMPORTANT DISCLOSURES
This material is for general information only and is not intended to provide specific advice or recommendations for any individual. There is no assurance that the views or strategies discussed are suitable for all investors or will yield positive outcomes. Investing involves risks including possible loss of principal. Any economic forecasts set forth may not develop as predicted and are subject to change.
References to markets, asset classes, and sectors are generally regarding the corresponding market index. Indexes are unmanaged statistical composites and cannot be invested into directly. Index performance is not indicative of the performance of any investment and do not reflect fees, expenses, or sales charges. All performance referenced is historical and is no guarantee of future results.
Any company names noted herein are for educational purposes only and not an indication of trading intent or a solicitation of their products or services. LPL Financial doesn’t provide research on individual equities.
All information is believed to be from reliable sources; however, LPL Financial makes no representation as to its completeness or accuracy.
U.S. Treasuries may be considered “safe haven” investments but do carry some degree of risk including interest rate, credit, and market risk. Bonds are subject to market and interest rate risk if sold prior to maturity. Bond values will decline as interest rates rise and bonds are subject to availability and change in price.
The Standard & Poor’s 500 Index (S&P500) is a capitalization-weighted index of 500 stocks designed to measure performance of the broad domestic economy through changes in the aggregate market value of 500 stocks representing all major industries.
The PE ratio (price-to-earnings ratio) is a measure of the price paid for a share relative to the annual net income or profit earned by the firm per share. It is a financial ratio used for valuation: a higher PE ratio means that investors are paying more for each unit of net income, so the stock is more expensive compared to one with lower PE ratio.
Earnings per share (EPS) is the portion of a company’s profit allocated to each outstanding share of common stock. EPS serves as an indicator of a company’s profitability. Earnings per share is generally considered to be the single most important variable in determining a share’s price. It is also a major component used to calculate the price-to-earnings valuation ratio.
All index data from FactSet.
This research material has been prepared by LPL Financial LLC.
Securities and advisory services offered through LPL Financial (LPL), a registered investment advisor and broker-dealer (member FINRA/SIPC). Insurance products are offered through LPL or its licensed affiliates. To the extent you are receiving investment advice from a separately registered independent investment advisor that is not an LPL affiliate, please note LPL makes no representation with respect to such entity.
Not Insured by FDIC/NCUA or Any Other Government Agency | Not Bank/Credit Union Guaranteed | Not Bank/Credit Union Deposits or Obligations | May Lose Value
RES-934700-1021 | For Public Use | Tracking # 1-05204667 (Exp. 10/22)